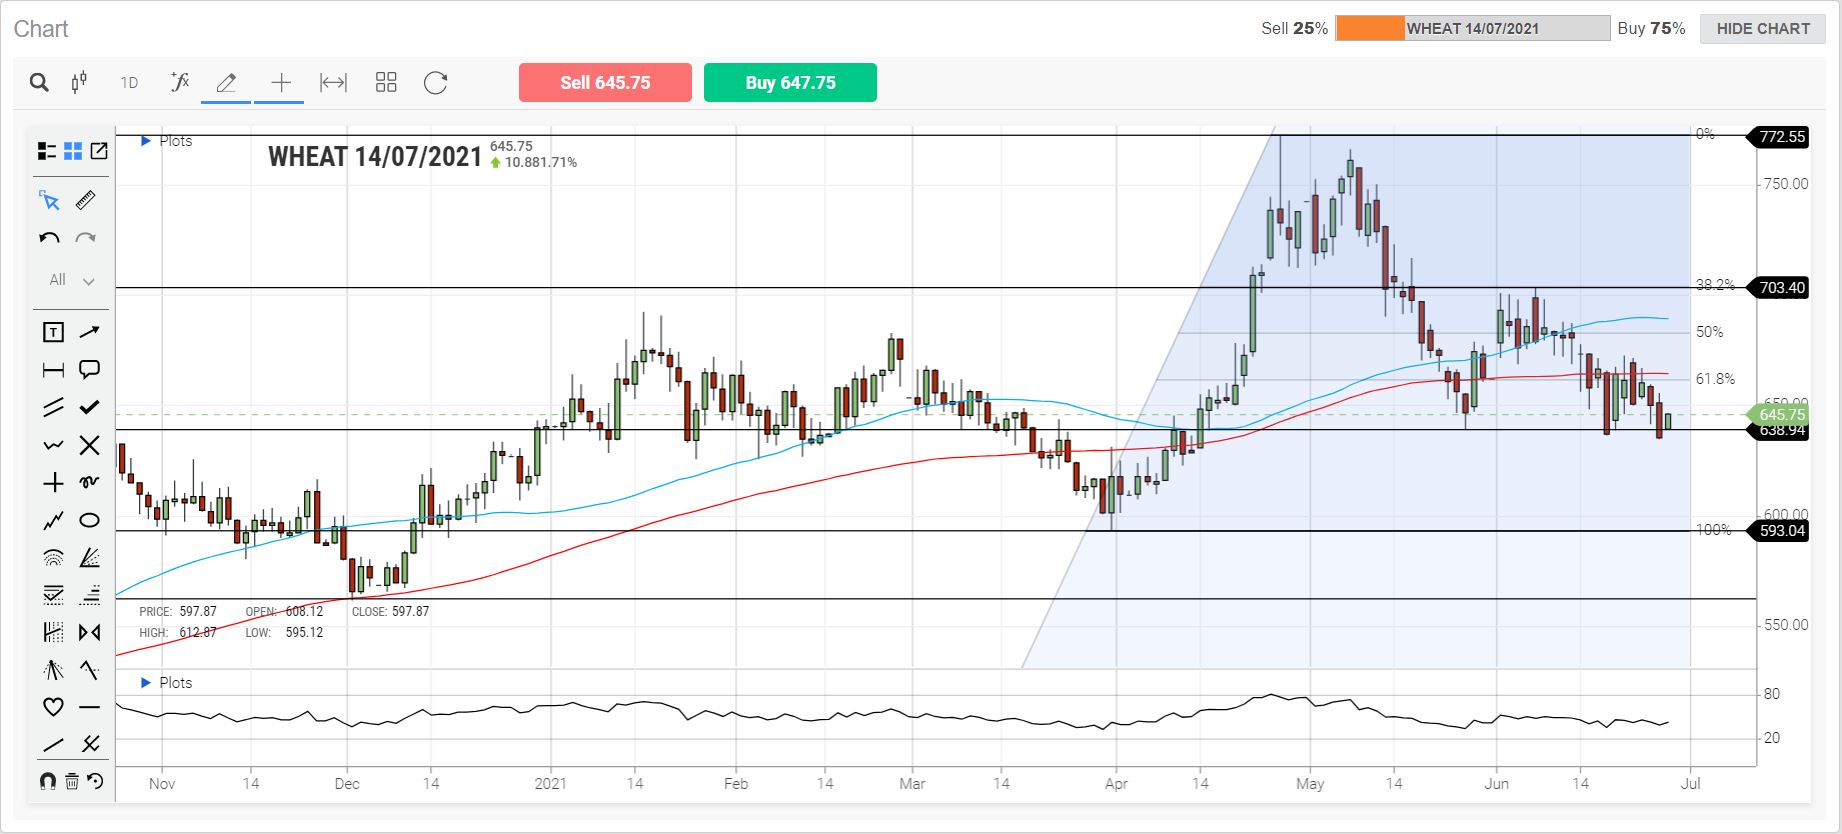
For the bulls, important resistance levels exist at the 665.00 level where the MA100 coincides with the 61.8% Fibonacci retracement, also at 685.00 where the MA50 meets the 50% retracement level, and finally at the 703.00 level derived from the top of the 7th of June.
For the bears, important support levels exist at 639.00 derived from the bottom of the 26th of May, also at 593.00 which is the bottom of the last upward move on March 31st, and finally at 562.00 derived from the bottom of December 1st 2020.
It is a particularly quiet day on the economic calendar in the US. There are no material stats to provide the majors with direction through the US session.
• U.S. stocks were mixed after the close on Friday, as gains in the Consumer Goods, Utilities and Financials sectors led shares higher while losses in the Technology, Basic Materials and Telecoms sectors led shares lower.
At the close in NYSE, the Dow Jones Industrial Average added 0.69%, while the S&P 500 index climbed 0.33%, and the NASDAQ Composite index lost 0.06%.
• U.S. consumer spending was unchanged in May, likely as shortages hurt purchases of goods like motor vehicles, but the supply constraints helped to boost inflation.
The Commerce Department said on Friday that the unchanged reading in consumer spending, which accounts for more than two-thirds of U.S. economic activity, followed an upwardly revised 0.9% jump in April. Consumer spending was previously reported to have increased 0.5% in April.
• Inflation in the US, as measured by the Personal Consumption Expenditures (PCE) Price Index, was 0.4% in May, the US Bureau of Economic Analysis reported on Friday. On a yearly basis, the PCE Price Index edged higher to 3.9% from 3.6%, compared to analysts' estimate of 4%.
More importantly, the annual Core PCE Price Index, the Federal Reserve's preferred gauge of inflation, rose to 3.4% in May, matching the market consensus.
• Gold clinched on Friday its first weekly gain in four and since its unceremonious fall from $1,900 levels. But the difference was hardly something for longs in the yellow metal to crow about.
It was a woeful previous three weeks for gold longs who watched miserably as the benchmark futures contract in gold cascaded from five-month highs of just over $1,919 to a seven-week low of just above 1,761 at one point. That was a loss of almost $160 or more than 8%.
• The S&P 500 ended the week at record high on Friday, lifted by Nike and several banks, while weaker-than-expected inflation data eased worries about a sudden tapering in stimulus by the Federal Reserve.
Nike Inc (NYSE:NKE) surged 15.5% to an all-time high after the sneaker maker forecast fiscal full-year sales ahead of Wall Street estimates, helping the Dow lead among the three main indexes.
Bank of America (NYSE:BAC) climbed 1.9% and Wells Fargo (NYSE:WFC) rallied 2.7% after the Fed announced big banks have cleared stress test and will no longer face pandemic-related restrictions on buying back stock and paying dividends.
The S&P 500 financials index rose 1.3% and was the top performers among 11 sector indexes.
Important Daily Events:
• At 13:00 (GMT) Federal Reserve Bank of New York President John Williams due to participate in a virtual panel discussion hosted by the Bank for International Settlements. Audience questions expected.
US Indices Friday:
• Dow Jones +0.69%
• S&P 500 +0.33%
• Nasdaq -0.06%
Sources: Investing.com, forexfactory.com, fxstreet.com
