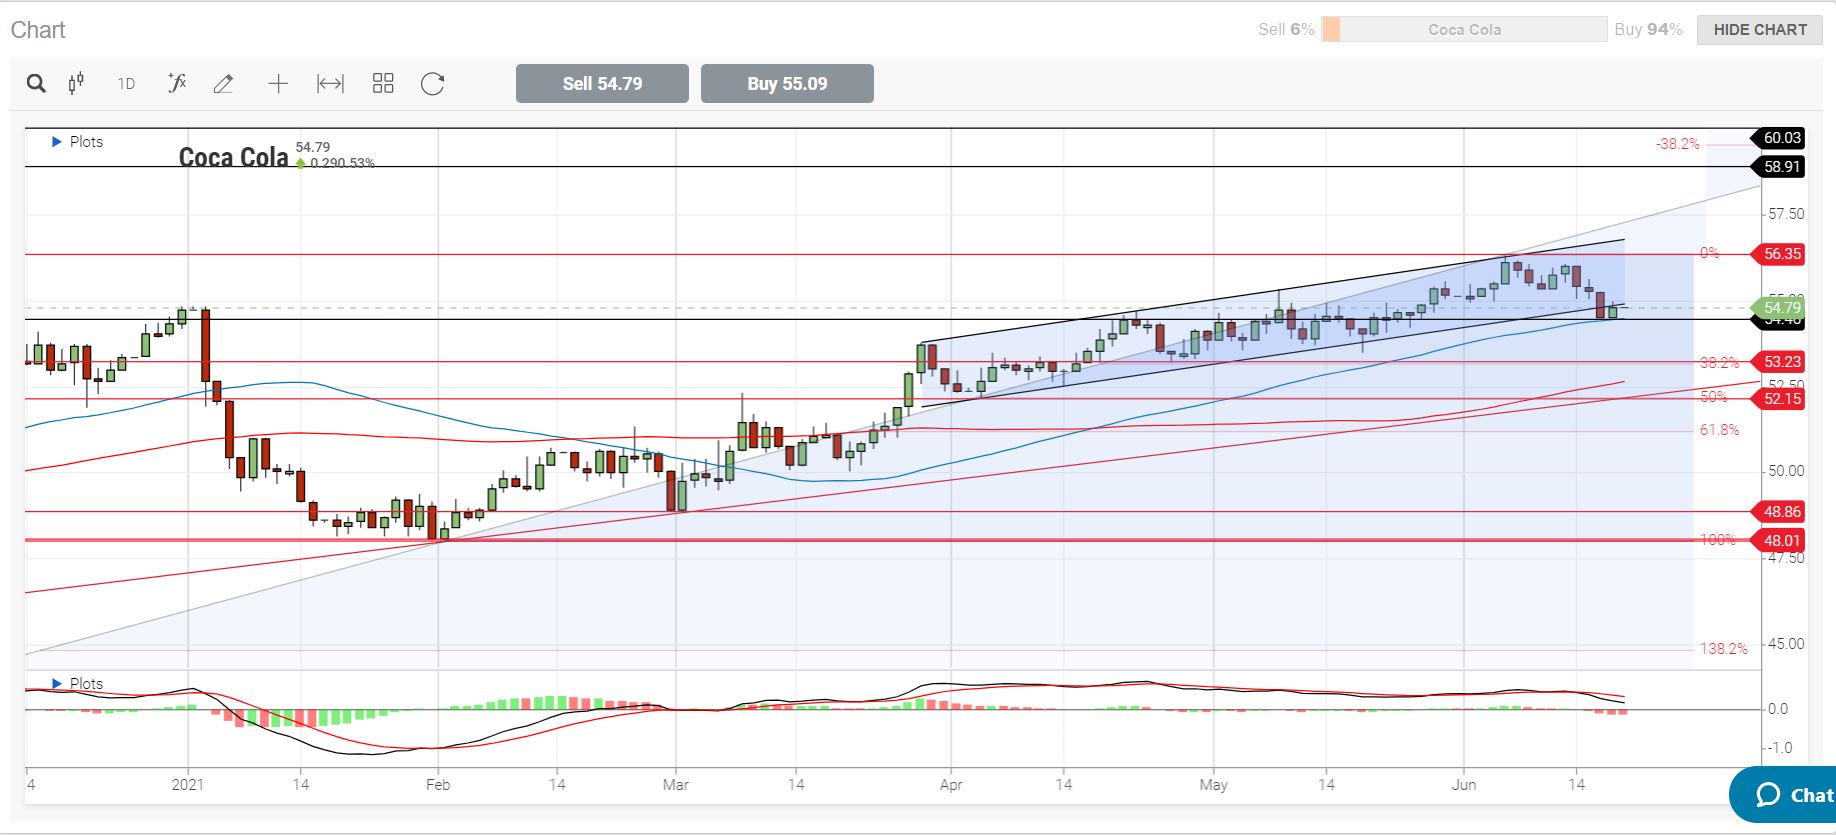
For the bulls, important resistance levels exist at 56.35 from the June 4th top, also at $58.90 from the top om March 4th 2020, and finally at the $60.00 derived from the multi-year top of 24th February 2020.
For the bears important support levels exist at $54.50 where the MA50 stands now, also at $53.23 price that is at 38.2% Fibonacci retracement level of the last upward move, and finally at $52.15 price that the 50% Fibonacci retracement lies right now. Also look for support on the position of the MA100.
It’s a mute day ahead on the US economic calendar. Any market direction will come from possible chatter by officials due to lack of Economic Statistics.
• U.S. stocks were mixed after the close on Thursday, as gains in the Technology, Healthcare and Consumer Services sectors led shares higher while losses in the Oil & Gas, Basic Materials and Financials sectors led shares lower.
At the close in NYSE, the Dow Jones Industrial Average lost 0.62% to hit a new 1-month low, while the S&P 500 index lost 0.04%, and the NASDAQ Composite index climbed 0.87%.
• Initial unemployment claims unexpectedly rose last week to end a six-week streak of improvements, even as economic activity ramped further and re-openings broadened out. But in the coming weeks, a phase-out of enhanced unemployment benefits across many states may decrease the total number of claimants.
Initial jobless claims, week ended June 12:
412,000 vs. 360,000 expected and a revised 375,000 during prior week
Continuing claims, week ended May 5:
3.518 million vs. 3.425 million expected and a revised 3.517 million during prior week
• The Federal Reserve Bank of Philadelphia reported on Thursday that the headline Manufacturing Activity Index of the Manufacturing Business Outlook Survey dropped to 30.7 in June from 31.5 in May. This reading came in weaker than the market expectation of 31.
Further details of the publication showed that the New Orders Index declined to 22.2 from 32.5, the Employment Index improved to 30.7 from 19.3 and the Prices Paid Index rose to 80.7 from 76.8.
• Canada added 101,600 jobs in May, the fourth consecutive month of gains, led by hiring in the education and health services sector as well as in professional and business services, a report from payroll services provider ADP showed on Thursday.
The April data was revised to show 101,300 jobs were gained, rather than an increase of 351,300. The report, which is derived from ADP's payrolls data, measures the change in total nonfarm payroll employment each month on a seasonally-adjusted basis.
• The U.S. Energy Information Administration reported on Thursday that domestic supplies of natural gas rose by 16 billion cubic feet for the week ended June 11.
Following the data, July natural gas was down 4.5 cents, or 1.4%, at $3.21 per million British thermal units. It traded at $3.23 shortly before the data.
US Indices yesterday:
• Dow Jones -0.62%
• S&P 500 -0.04%
• Nasdaq +0.87%
Sources: Investing.com, forexfactory.com, finance.yahoo.com, breakingthenews.net
