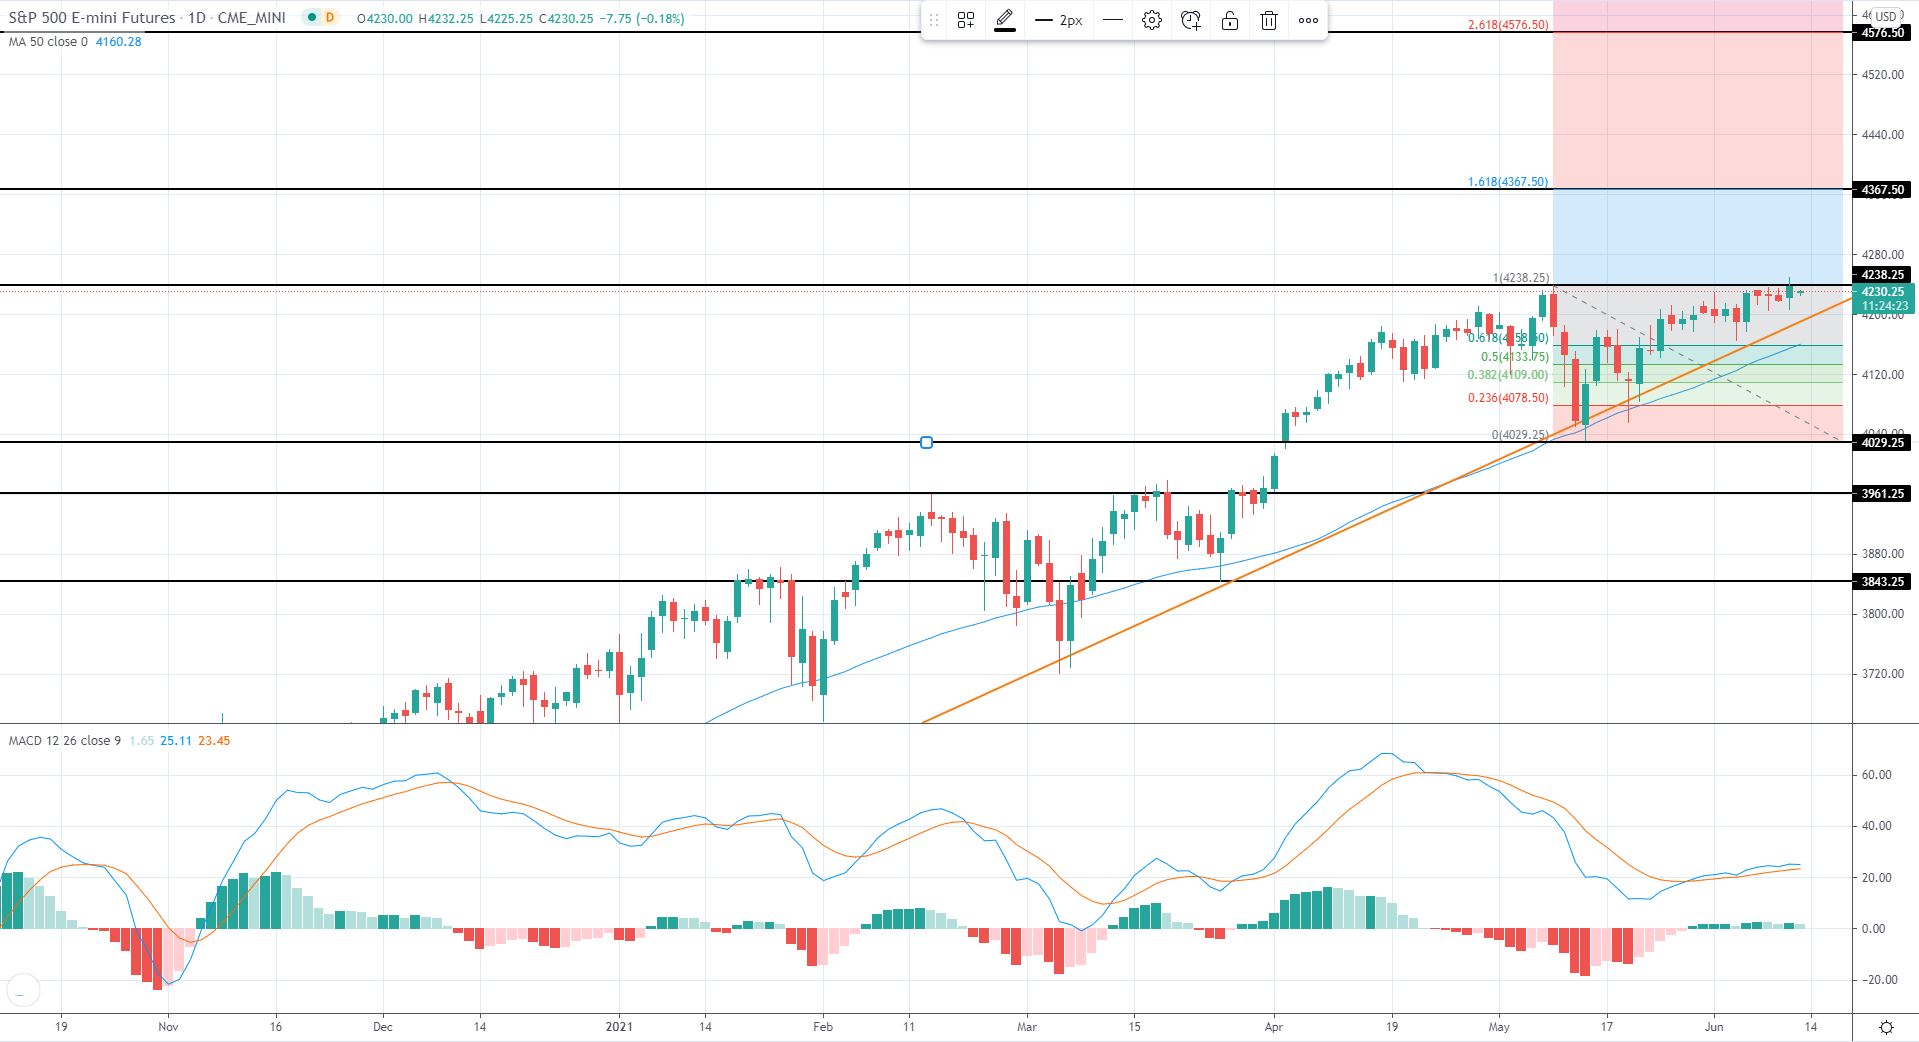
For the bulls, important resistance points at May 10th hight of 4238.25, also at 4367.50 Fibonacci 161.8 extension target, and finally at the 261.8% Fibonacci extension target at level 4576.50.
For the bears, important support levels exist at 4200.00 area where the uptrend line lies now with the MA50 following it, also at 4029.25 where the May 13th low was registered, and finally at 3961.25 inside swing support derived from the top of March 18th 2021.
• It’s a busier day ahead on the economic calendar. Later today, consumer sentiment figures from the U.S and updates from the G7 Summit will possibly influence the markets. Announcements include CAD Capacity Utilization Rate, US Preliminary UoM Consumer Sentiment and UoM Inflation Expectations as well as possible comments from Fed officials.
• U.S. stocks were higher after the close on Thursday, as gains in the Healthcare, Technology and Consumer Services sectors led shares higher.
At the close in NYSE, the Dow Jones Industrial Average gained 0.06%, while the S&P 500 index gained 0.47%, and the NASDAQ Composite index gained 0.78%.
• The number of initial jobless claims in the United States for the week ending June 4 decreased 9,000 from the previous week's unrevised level to 376,000, falling below market expectations, the US Labor Department unveiled on Thursday.
• The Labor Department said its consumer price index increased 0.6% last month after surging 0.8% in April, which was the largest gain since June 2009.
In the 12 months through May, the CPI accelerated 5.0%. That was the biggest year-on-year increase since August 2008, and followed a 4.2% rise in April.
• Excluding the volatile food and energy components, the CPI increased 0.7% after soaring 0.9% in April. The so-called core CPI was driven by a 7.3% rise in used cars and trucks prices, which was on top of a 10.0% jump in April.
• At 12:30 (GMT) CAD Capacity Utilization Rate is due. This measures the proportion of potential economic output that is actually realized. Displayed as a percentage, the capacity utilization level provides insight into the overall slack that is in an economy or a firm at a given point in time.
• At 14:00 (GMT) US Prelim University of Michigan (UoM) Consumer Sentiment coming up. Financial confidence is a leading indicator of consumer spending, which accounts for a majority of overall economic activity.
• At 14:00 (GMT) US University of Michigan (UoM) Inflation Expectations also coming up. This registers the Percentage that consumers expect the price of goods and services to change during the next 12 months.
US Indices yesterday:
• Dow Jones +0.06%
• S&P 500 +0.47%
• Nasdaq +0.78%
Sources: Investing.com, forexfactory.com
