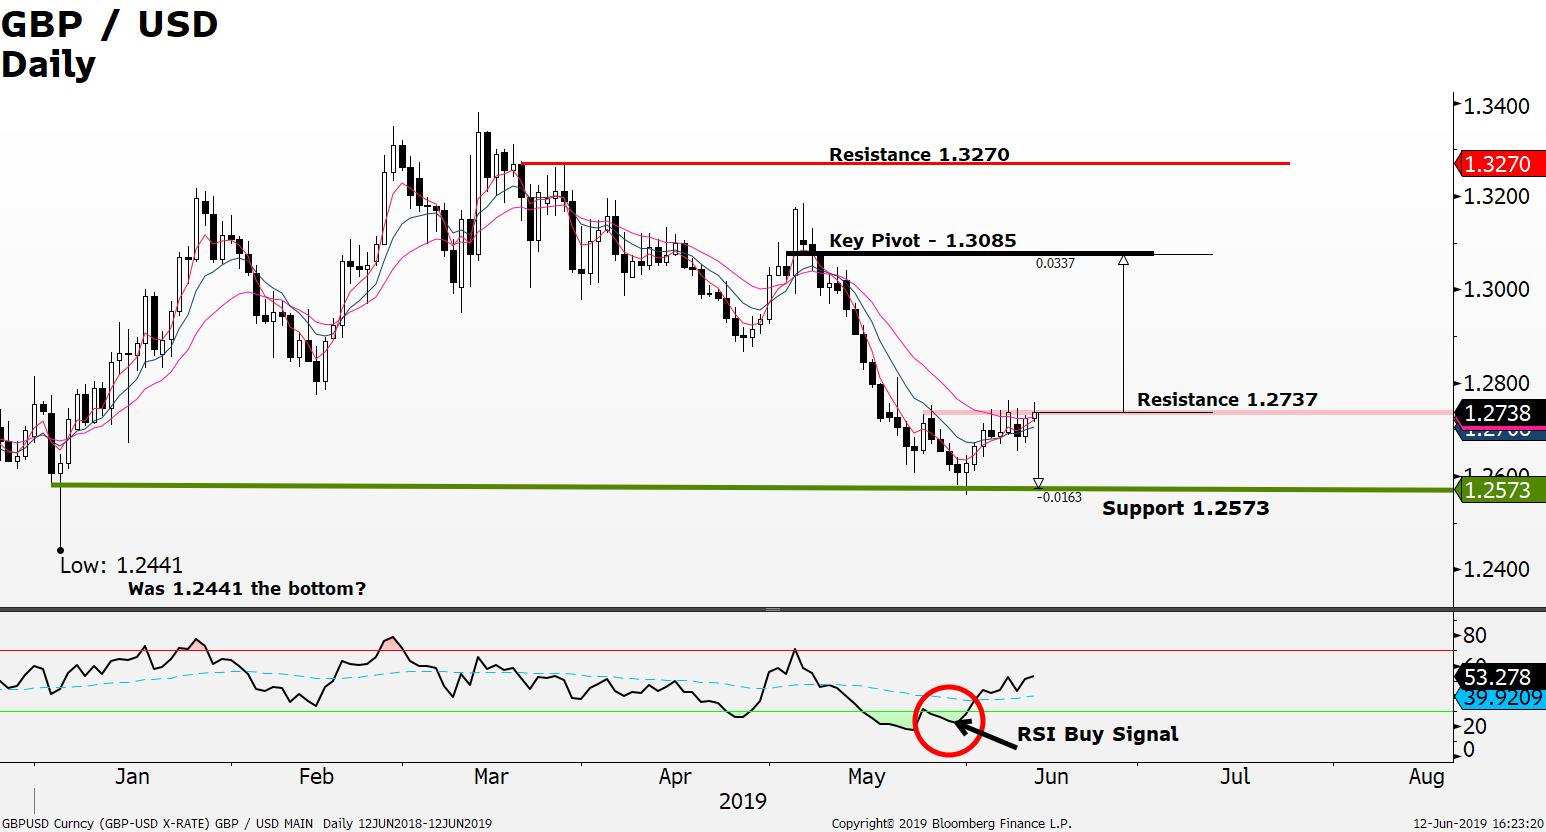
Technical Commentary: GBP/USD daily chart RSI indicator Buy signal spotted (RSI crossed above signal line); current price attempting to break above the 1.2737 resistance level; risk reward for buys around +300 pips upside; downside -160 pips; upside on break seen near 1.3085 key pivot; while support remains at 1.2573.

Platinum prices +$15 last 5 days rising in line with Gold and other precious metals as US-China trade deal negotiating delay’s hold uncertainty over the financial markets; Platinum current price $817; upside resistance seen near the 50 to 61.8% April to May Fibonacci retracements identified as $867.30; while downside seen as limited to $780. Long positions offer good risk reward ratios.

Crude Oil (CL) in a multi-week downtrend as rising inventories and supply demand concerns add downside pressure on Crude Oil prices; current price trading near the $51.70 support level a break below opens up the potential for Crude Oil (CL) to fall a further -$16 to $18 towards the December 2018 – April 2019 retracement levels $35.80 - $33.80.

EUR/ USD pushing higher after US president said that the Euro is 22% too cheap and recent US CPI data shows that US Inflation has slowed building the case for the US FED to cut interest rates adding downside pressure for the USD while lifting the Euro ; EUR/USD breaks above the 1.1315 resistance; current price 1.1335 +117 pips last 5 days; upside 1.1375 to 1.1450 resistance area; supports spotted at 1.1210 and 1.1150.

SP500 Index currently trading above its multi-week downward trendline (Bullish) momentum analysis indicates bullish momentum remains; current price 2894.7; resistance at 2895 needs to be overcome in order for the SP500 to continue its advanced towards new all-time highs; buyers of the SP500 are speculating that US interest rate cuts will support US stock markets; support zone seen at 2690.50 to 2630; upside remains provide price can break above 2895 resistance;

