Last week the US Indices continued their big losses
The EU Indices limited their previous big losses in smaller ones, showing some reaction
- USA Indices: -8%
- DAX 30: -3.26%
- IBEX35: -3%
- CAC 40: -2.5%
- EURO Stoxx: -7.40%
- MIB 40: -1.8%
The U.S. Treasury Secretary, Steven Mnuchin, on Thursday urged Congress immediately to pass a $1 trillion economic relief measure by early next week
The European Central Bank (ECB) has unveiled a €750 billion response to the coronavirus in a bid to calm the financial markets.
The European Commission on Saturday approved France's plan to guarantee up to 300 billion euros ($323 billion) in state aid to ease the economic burden of the coronavirus.
On the Charts
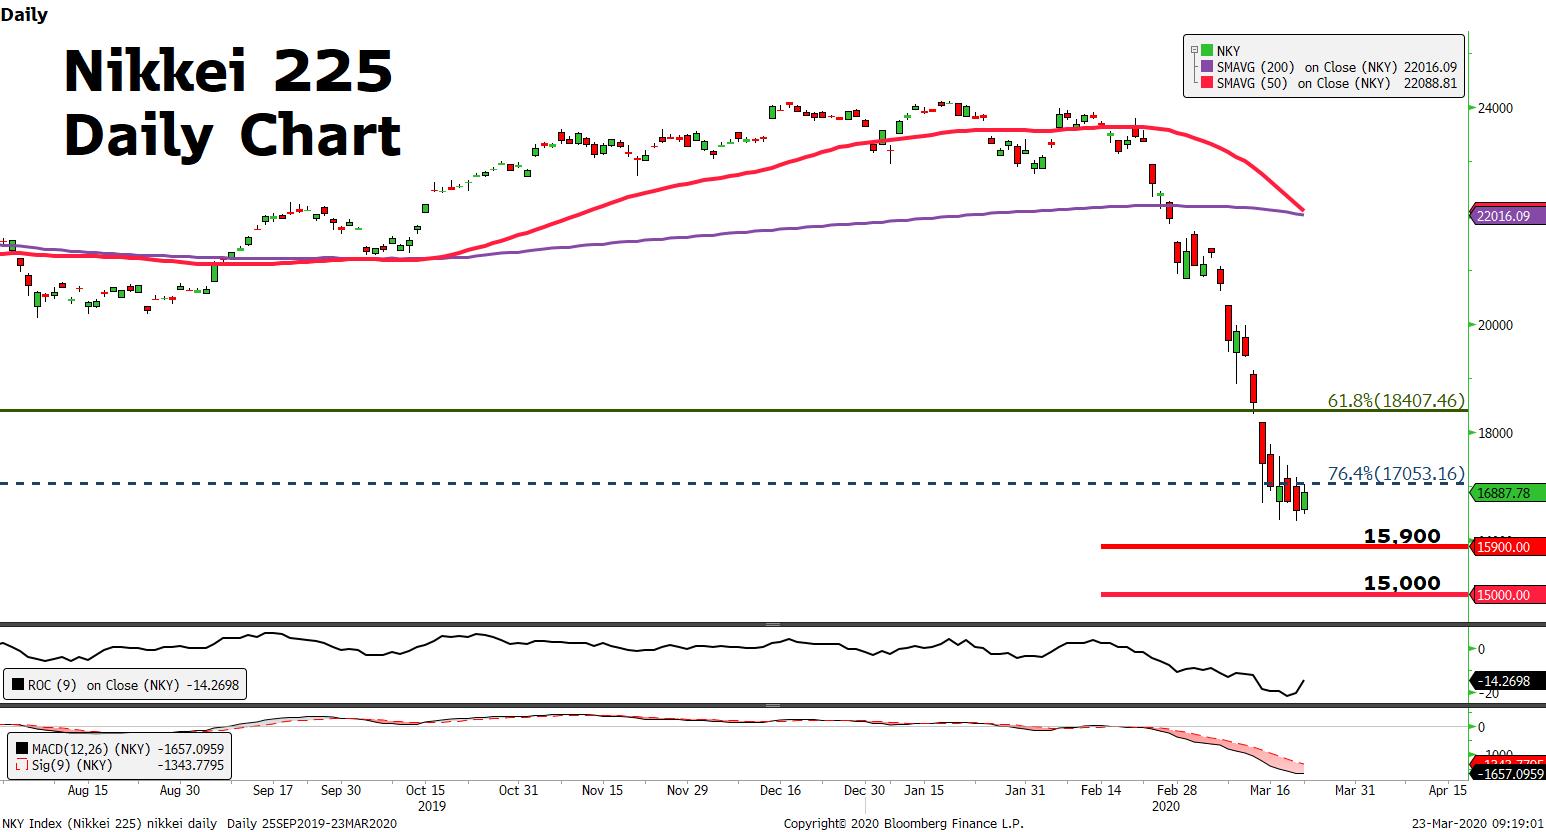
Nikkei 225 (Japan Index) price is now at 16,887
On the daily chart, we can observe that the price had broken to the downside the 76.4% Fibonacci retracement level (From 14864 to 24140) – the blue dashed line
Price is below the 50 (red) and 200 (purple) days Moving Average
The 50 days is getting ready to cross to the downside of the 200 days
Momentum is bearish, since both Rate of Change (9 periods) and MACD are below zero
If the price fails to break the 76.4% Fibonacci Level – at 17,053 – to the upside and closed below that level, there is a possibility to see the price moving lower to the previous support, at 15,900 or even lower to 15,000
Otherwise, if the price reacts and closes above 17,053 then we may see the price finding resistance to the 61.8% Fibonacci Level (From 14864 to 24140), a previous retracement that it had been broken to the downside
Source : FXGM Investment Research Department / Bloomberg
