- In today’s Economic Calendar we can expect some volatility in the USD
- At 12:30 (GMT), the Department of Labour Statistics of the USA will announce their Initial Jobless Claims
- That measures the number of people who have submitted for the first-time claims for state unemployment insurance
- The result is forecasted an increase to 220,000, considering that last week it was at 211,000
- Yesterday, the Energy Information Administration of the USA announced the Crude Oil Stocks Change
- The outcome was that there was a decrease to 1.954M barrels, considering that last week’s number was at 7.664M
On the Charts
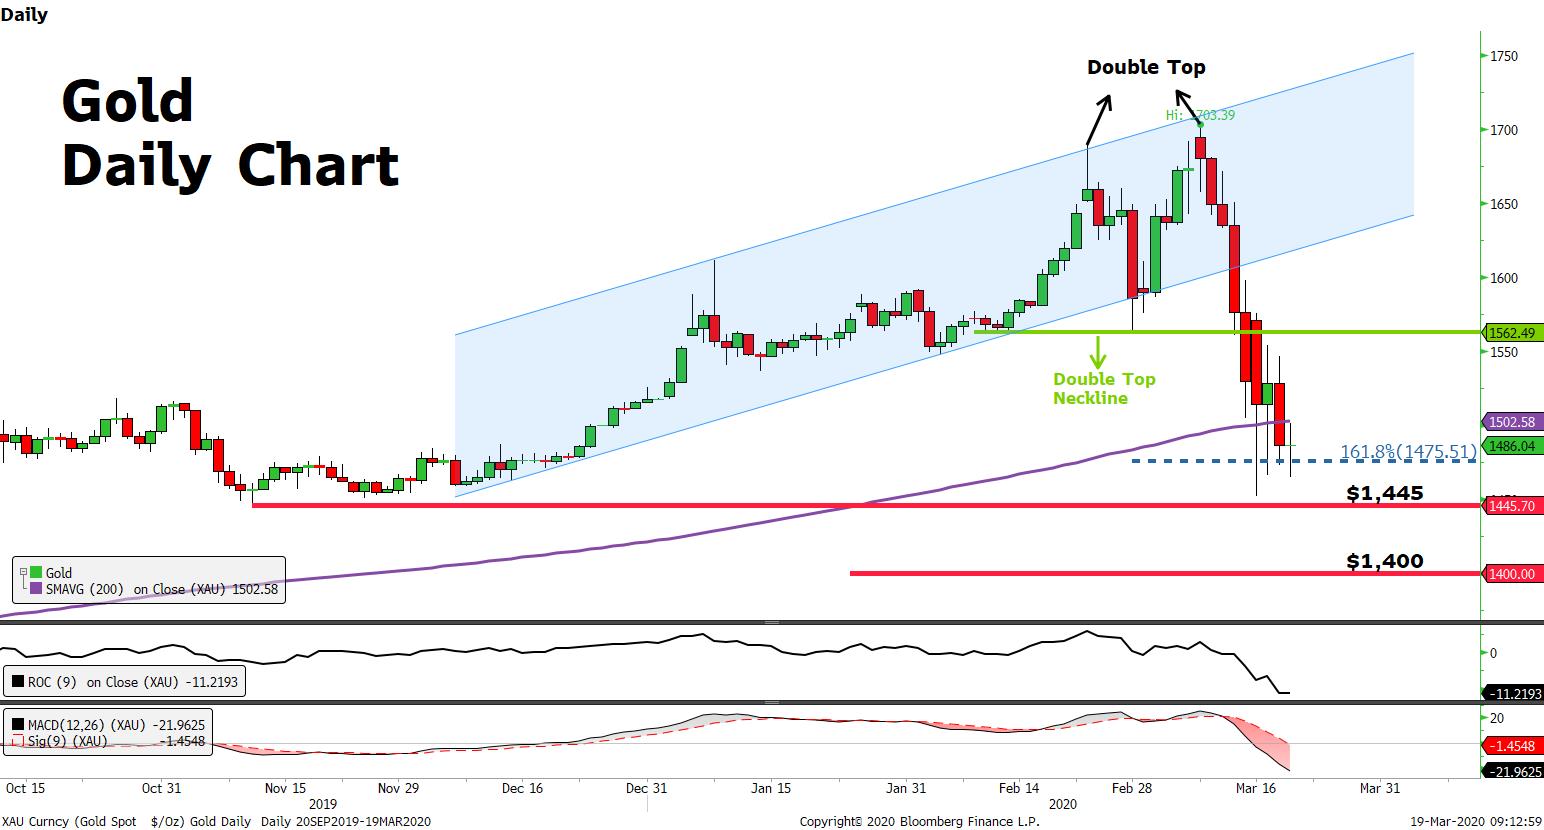
- Gold price is now at $ 1,486
- This precious metal formed a Double Top formation (Major Reversal Pattern) inside its Upward Trading Channel
- Recently it broke the formation’s neckline to the downside
- Now the price is testing its 200 days Moving Average (purple line) and the 161.8% Fibonacci Extension level (From 1562 to 1703)
- The momentum remains bearish, since Rate of Change (9 periods) and MACD are both below zero
- If we observe the price closing below the 200 days Moving Average, then there’s a possibility we may see the metal’s price going lower to $1,445 – the target of the formation- or lower to $1,400, a previous support point
Source : FXGM Investment Research Department / Bloomberg
