Crude Oil
Today: +2.67%
Last week: +15.97%
Dow Jones
Today: +1%
Last week: -2.46%
DAX 30
Today: +1.57%
Last week: -4.17%
Gold:
Today: +1.14%
Last Week: +2.30%
On the Charts
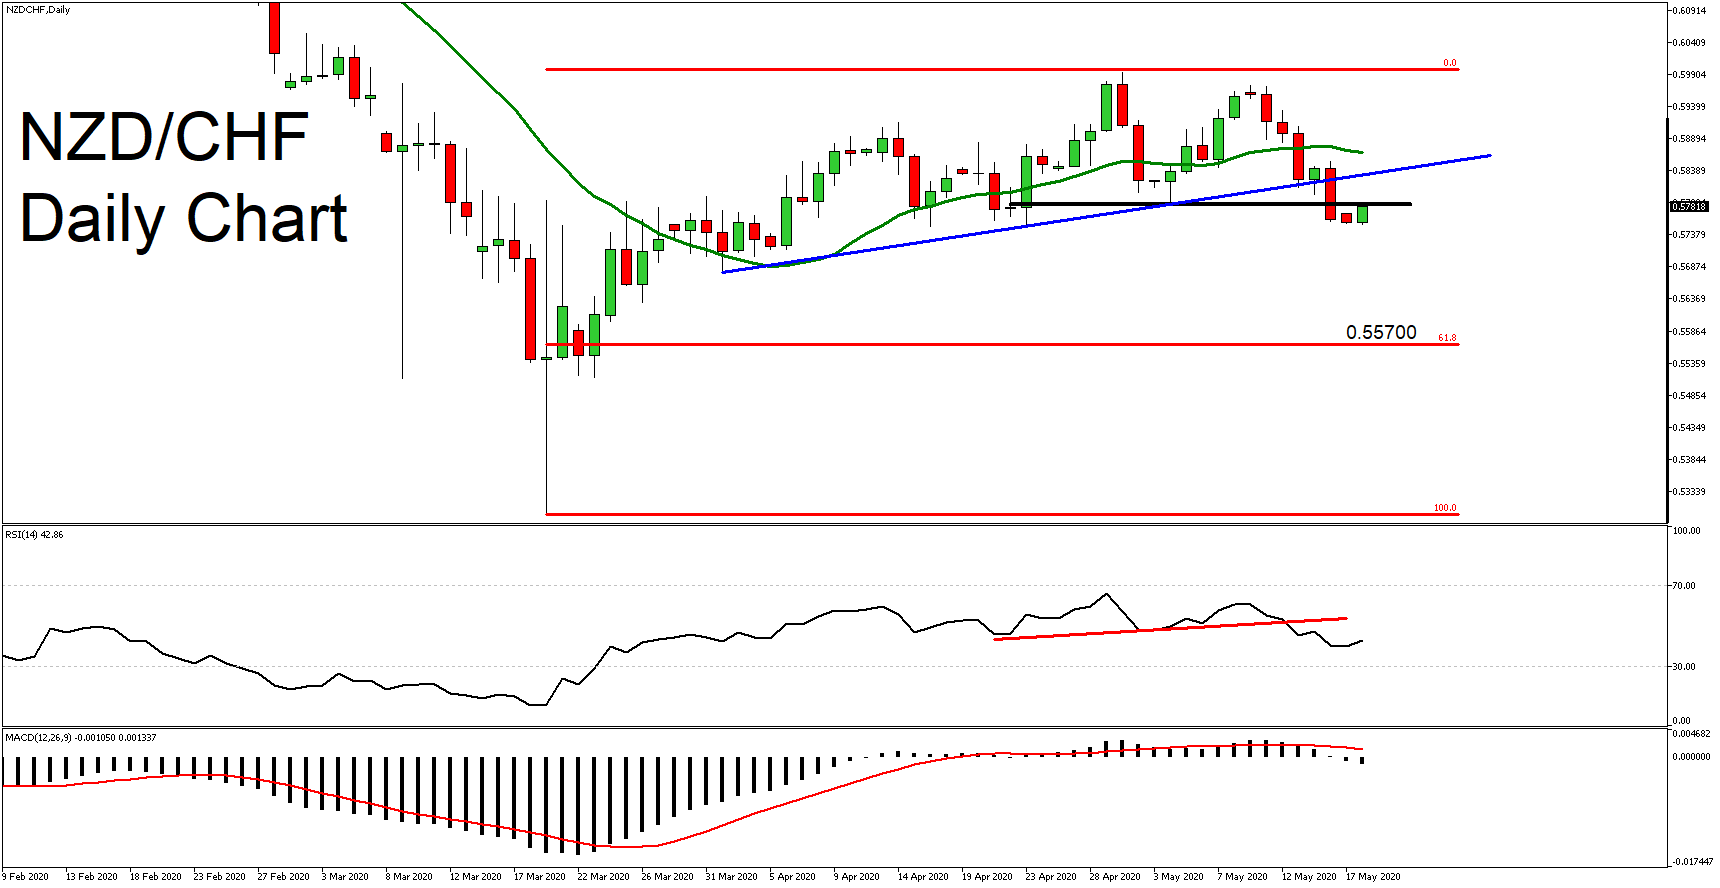
- As we can observe on the NZD/CHF Daily Chart, the price has formed a double top formation.
- The price now is below the 20 days moving average (green), the upward trendline (blue) and the neckline of the formation (black).
- The price is now at 0.57800, and after the breakout of the neckline it is retesting it.
- The RSI* has also formed a double top formation, confirming the price, and is now at 42.
- The MACD* is below 0.
- Considering the above, if the price closes below the black line, we may see it continue lower, at 0.55700, a price level which consist the target of our formation and the 61.8% Fibonacci Retracement Level (From 0.52966 to 0.59976).
