The previous week
- Dow Jones 30: -5.75%
- Nasdaq 100: -1.59%
- S&P 500: -4.79%
- UK 100: -5.46%
- IBEX 35: -7.58%
- CAC 40: -6.25%
Today the Futures Indices opened with downside gap of 1.30%
- Gold: +2.82%
- Silver: +0.50%
- Crude Oil: -9.58%
On the Charts
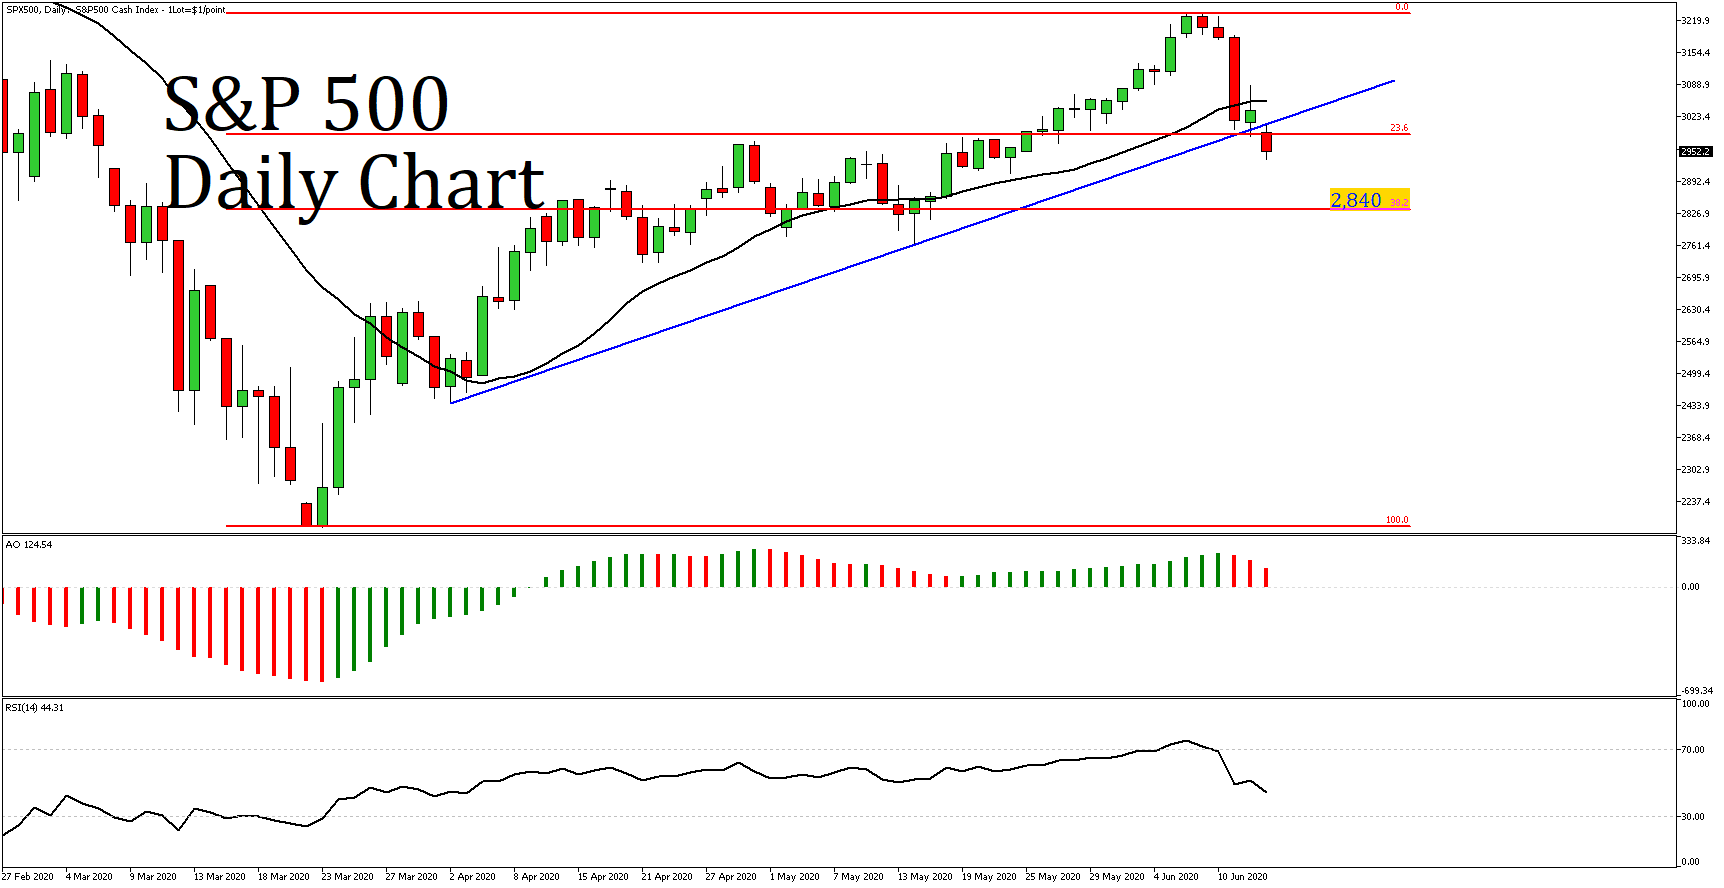
- As we can observe on the SP 500 daily chart, the price has broken below the upward blue trendline
- Today , the Index opened with gap to the downside
- The price is now at 2952, below the 20 days Moving Average (black)
- The price has broken the 23.6% Fibonacci Retracement Level (From 2185 to 3234)
- A negative divergence has been observed on Awesome Oscillator, since the oscillator failed to create a higher top, like the price did. Also, its bar is now red
- RSI has exited its overbought area at 80, and is now at 44
- Considering the above we may see the price moving lower to 2,840, a price level which consists the 38.2% Fibonacci Retracement Level (From 2185 to 3234)
