- The price of Crude Oil swung between gains and losses on Monday 13th April 2020, after the historical decision of reducing oil production
Commodities yesterday:
Gold: +2.95%
Silver: +2.69%
Palladium: +1.35%
Platinum: +2.15%
Crude Oil: +0.67%
Natural Gas: +0.35%
Copper: +1.63%
- After the positive figures of last week, US Stocks yesterday closed with an average loss of 0.60%
American Indices yesterday
Dow Jones 30: -1.39%
S&P 500: -1.01%
Nasdaq 100: +0.48%
- In today’s Economic calendar we can expect to see some volatility in the USD, as at 12:30 (GMT) the US Department of Labor will release their Import Price Index
- Those figures show the changes in prices of imported products into the USA
- The result is expected to a further decrease to -1.7%, considering the last month was at -0.5%
On the Charts
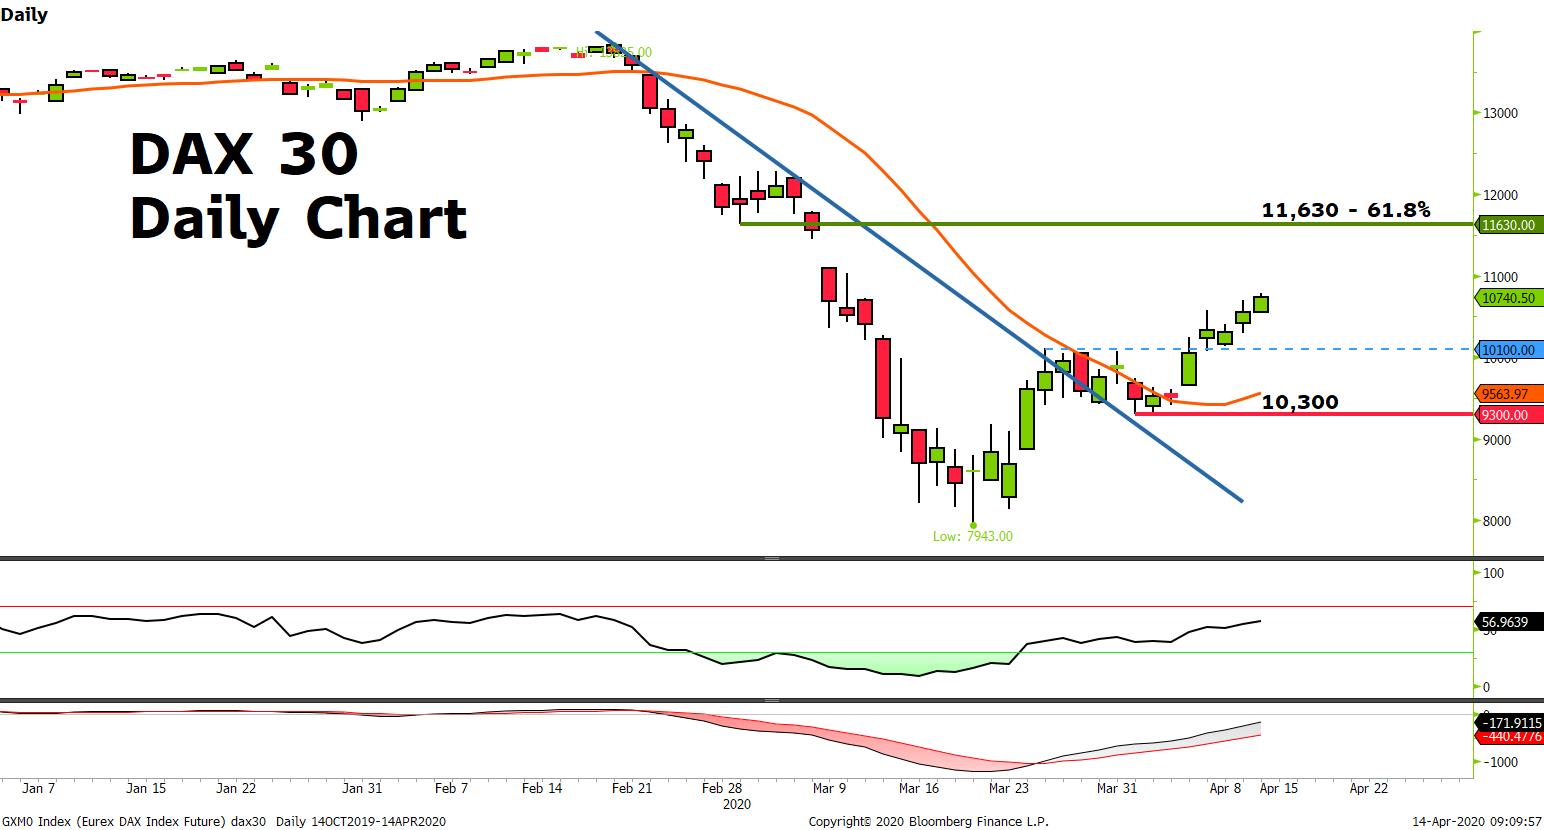
- The German DAX 30, after the sharp downward movement from the previous month, it has broken the blue downward trendline to the upside
- The index formed and completed a failure swing reversal formation since it created higher lows and higher highs after the bottom in mid-March
- Price is now at 10,745 higher than the previous support level 10,100 (blue dashed line), and above the 20 days Moving Average
- The RSI indicator is above 50 and the MACD signal line (red) crossed the MACD to the upside, showing some reaction to an upside attitude in the momentum
- Nevertheless, there is a possibility to see the price moving higher to test the 11,630 level - the previous resistance level and the 61.8% Fibonacci Retracement Level (From13,825 to 7,943)
- Alternatively, if the price breaks below the blue dashed line, at 10,100, we may see the DAX testing the previous support at 9,300 level
