- In the economic calendar of today we can expect some volatility in GBP, EUR, and USD
- At 06:00 (GMT) the National Statistics of UK released their Gross Domestic Product (GDP)
- GDP is a measure of the total value of all goods and services produced by the UK
- The result decreased to -18.2% considering the last month that was -5.8%
- Also, at 06:00 (GMT) the National Statistics of UK released their Industrial Production
- The above measures outputs of the UK factories and mines
- The result decreased to -20.3% considering the last month that was at -4.2%
- At 09:00 (GMT) the Statistics office of Europe (Eurostat) will release their Industrial Production
- The result is forecasted to decrease to -20% considering the last month that was -11.3%
- At 14:0 (GMT) the University of Michigan will release their Sentiment Index
- Michigan Consumer Sentiment Index is a survey of personal consumer confidence in economic activity
- The result is forecasted to increase to 75 considering the last month that was at 72.3
On the Charts
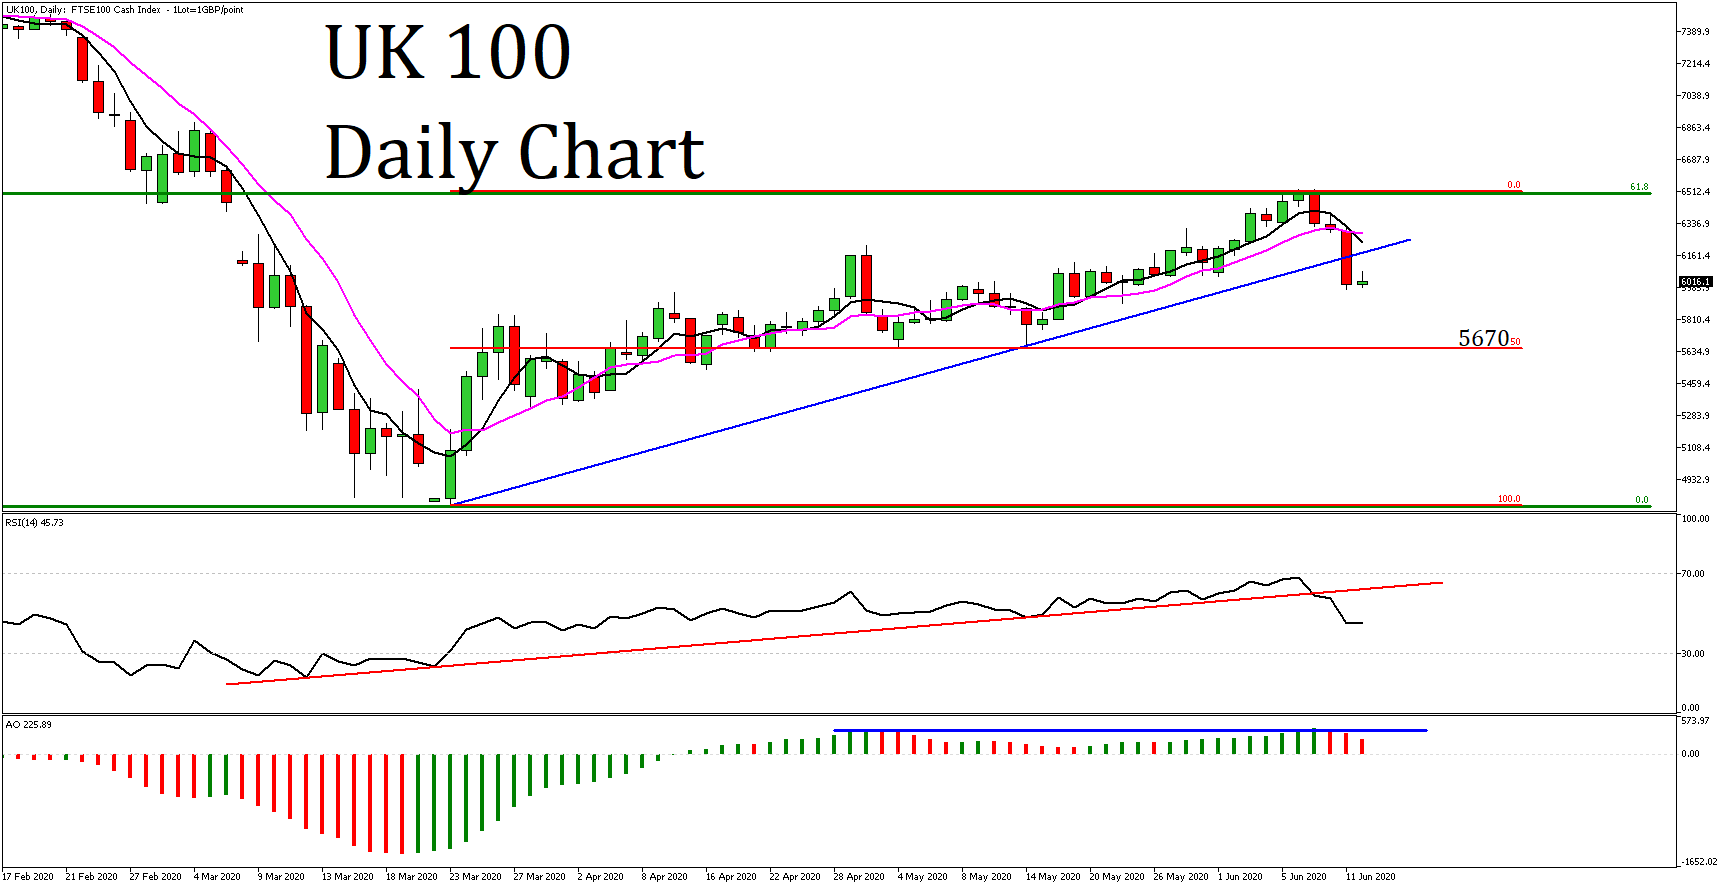
- As we can observe on the UK 100 Daily chart, the price has broken below the upward trendline that was in play for the last 2 and a half months
- The price, after the strong upward movement since the last days of March, it reacted to the 61.8% Fibonacci Retracement Level (green – From 7562 to 4790)
- The price is now at 6016, below the 5 (black) and 10 (magenta) days Moving Averages
- The 5 days crossed to the downside the 10 days
- RSI has broken its red upward trendline and is now below 50, at 47
- Awesome Oscillator (AO) has formed a double top formation and its bar is red
- Considering the above, we may see the price moving slightly higher and retest the trendline and then there is a possibility to move lower to 5670, a level which consists the 50% Fibonacci Retracement Level (From 4790 to 6510) and a previous tested support
