Investors have been waiting for US and China presidents meeting
Most Asian; European and US Stocks trending higher....but can the uptrend continue?
Time to enter or exit?
Market Drivers
- G-20 Summit; over the weekend global leaders and central bank governors from 19 countries and the European Union will meet for a G-20 Summit in Japan starting on Friday and will continue until Saturday (June 28 -29); Traders and investors will be keeping a close eye on a potential meeting between U.S. President Donald Trump and Chinese President Xi Jinping for fresh signals on the direction of the trade war; Monday morning Asian opening session will set the tone for European and American markets next week;
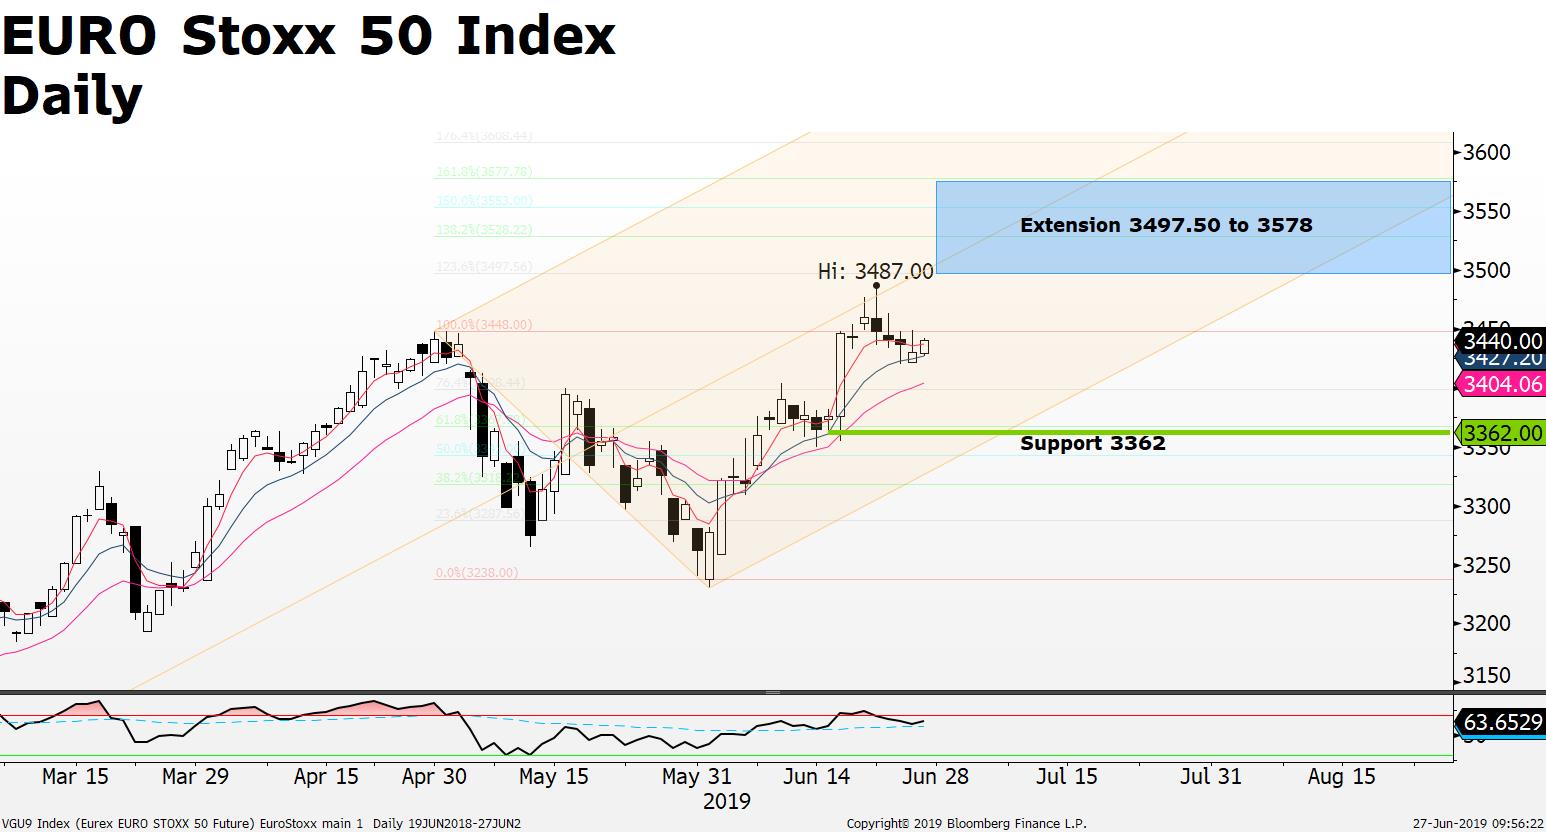
- European stock markets have recovered last 30 days; Eurostoxx 50 Index + 3.52%; French CAC40 +4.7%; Italian MIB +3.8%; Spanish IBEX +0.74%; German DAX + 2.4% this month on hopes that lower interest rates across the US and EU and a positive outcome from the US-China trade talks will keep stock markets pushing forward;

- European carmakers, such as BMW; Peugeot, Volvo and Ferrari are most sensitive European industry within the US versus the world trade war; BMW +1.7%; Peugeot +7%; Volvo +6.45%; Ferrari +10% all higher last 30 days on speculation positive trade deal outcomes;
- UK FTSE 100 benefiting from higher metals and energy prices as many of the worlds largest commodities producers are listed on the London stock exchange; FTSE 100 +2.34% last 30 days;

- Crude Oil +3.7% last 5 days after the US reported a drop in Crude Oil Inventories; price of WTI (CL) jumped to near the $60.50 resistance level before pulling back; current price $59.10; upside momentum remains intact however $60.50 needs to be cleared in order to keep further upside momentum going; support has been move higher from $53.50 to $56.60

- USD/JPY in multi-month downtrend; however signs of trend reversal indicated; recent demand for safety in the Japan YEN and increased prospects that the USD will weaken on US interest rate cuts has supported a stronger YEN over the previous months; however, RSI indicator is warning of a potential downtrend reversal higher; current price 108.14; potential upside seen at 108.70; while downside near the 105.35 support;

Source: FXGM / Bloomberg
