Did you know that stock markets are trading at or near their all-time historic highs?
That’s right, the major global benchmark stock indices are up 7 to 30% year to date!
Sure, 7 to 30% sounds great.
But, how can anyone know when to get-in the market before such moves?
Fortunately, there are a few methods that can help a trader identify market trends.
First, in order to “get-in” before the crowd, it’s important to understand that markets move in cycles that consist of 3 trends.
These cycles are:
- Short-term trends last 2 to 6 weeks
- Intermediate trends last 6 weeks to 9 months, and
- Primary trends last 9 months to 2 years
The 3 trends are:
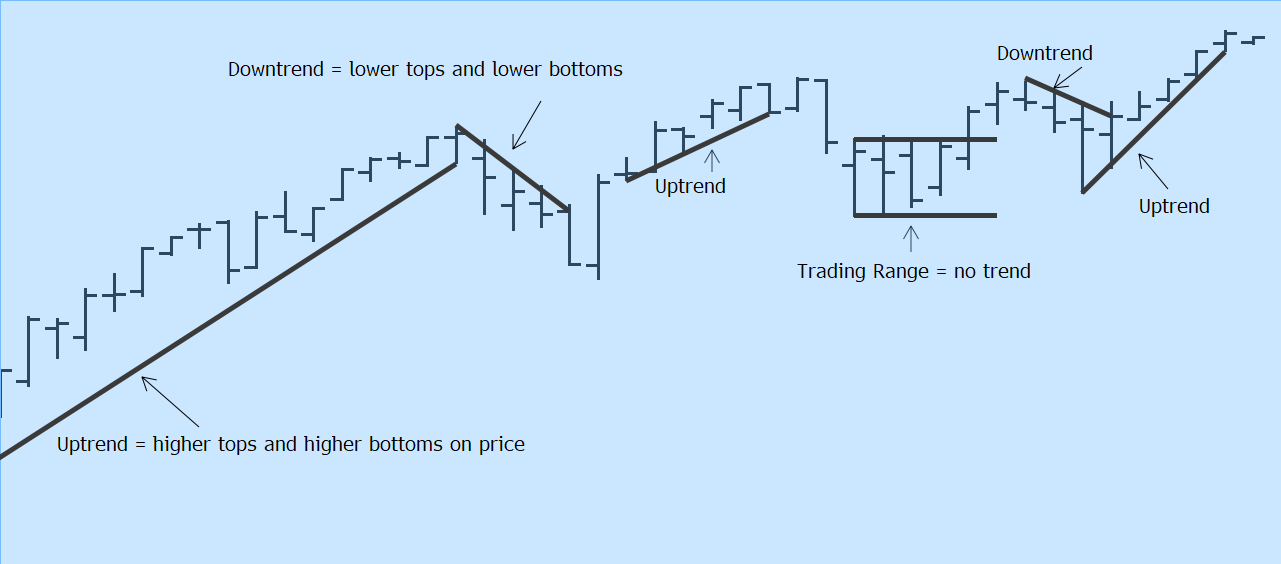
- Uptrend higher tops and higher bottoms on price
- Downtrend lower tops and lower bottoms on price
- Trading Range no higher tops or higher bottoms
What does an Uptrend look like?
If you spot higher tops and higher bottoms on price this would be an uptrend.
The short-term trend for the SP 500 Index indicates an uptrend.
A downtrend would be the opposite of an uptrend with lower tops and lower bottoms on price.

What does a Trading Range look like?
Below we can see the 9-month Intermediate chart for the SP 500.
A trading range can be identified before the current uptrend can be confirmed.

Trend following trading
One strategy used by traders is called trend following. Trend following is exactly that, following the trend. For a trend following trader this would result in always trading in the direction of the trend.
If you can spot an uptrend and use trend following as a strategy you would open a position in the direction of the trend. In an uptrend this would be a buy position and in a downtrend a sell position.
Be careful of trading ranges as this type of trend can be the most dangerous since trading ranges can be misleading. The best approaches for trading ranges is to either play the range – buy near the lower end of the range and sell near the upper end of the range and vice versa – or to trade the breakouts in the direction of the break.
Trading range breakouts happen after the price has moved within a trading range to the point that price either breaks above or below the range. In the case price breaks above the range, the trend follower would open a buy position and if price breaks below the range the trend follower would open a sell position.
A trend follower will always trade in the direction of the trend until signs that the trend is slowing or is about to change direction. Using momentum indicators can help the trend follower measure the strength of a prevailing trend, but we will leave that for another article.
Letting the market work for you
Once you have been able to identify a trend you can choose to follow that trend direction to better increase the chances of remaining on the right side of the market.
The magic of letting the market do the work can happen for you if you can spot a trend in its early stage, or even catch a momentum move as more and more traders jump into the trend.
So now that we have been able to identify that the SP500 index has recently broken towards the upside of its intermediate trading range trend, and since the short-term trend indicates that price is creating higher tops and higher bottoms on price, what would the trend trader do in this situation?
Good luck and happy trading.
Source: FXGM Investment Research Department
