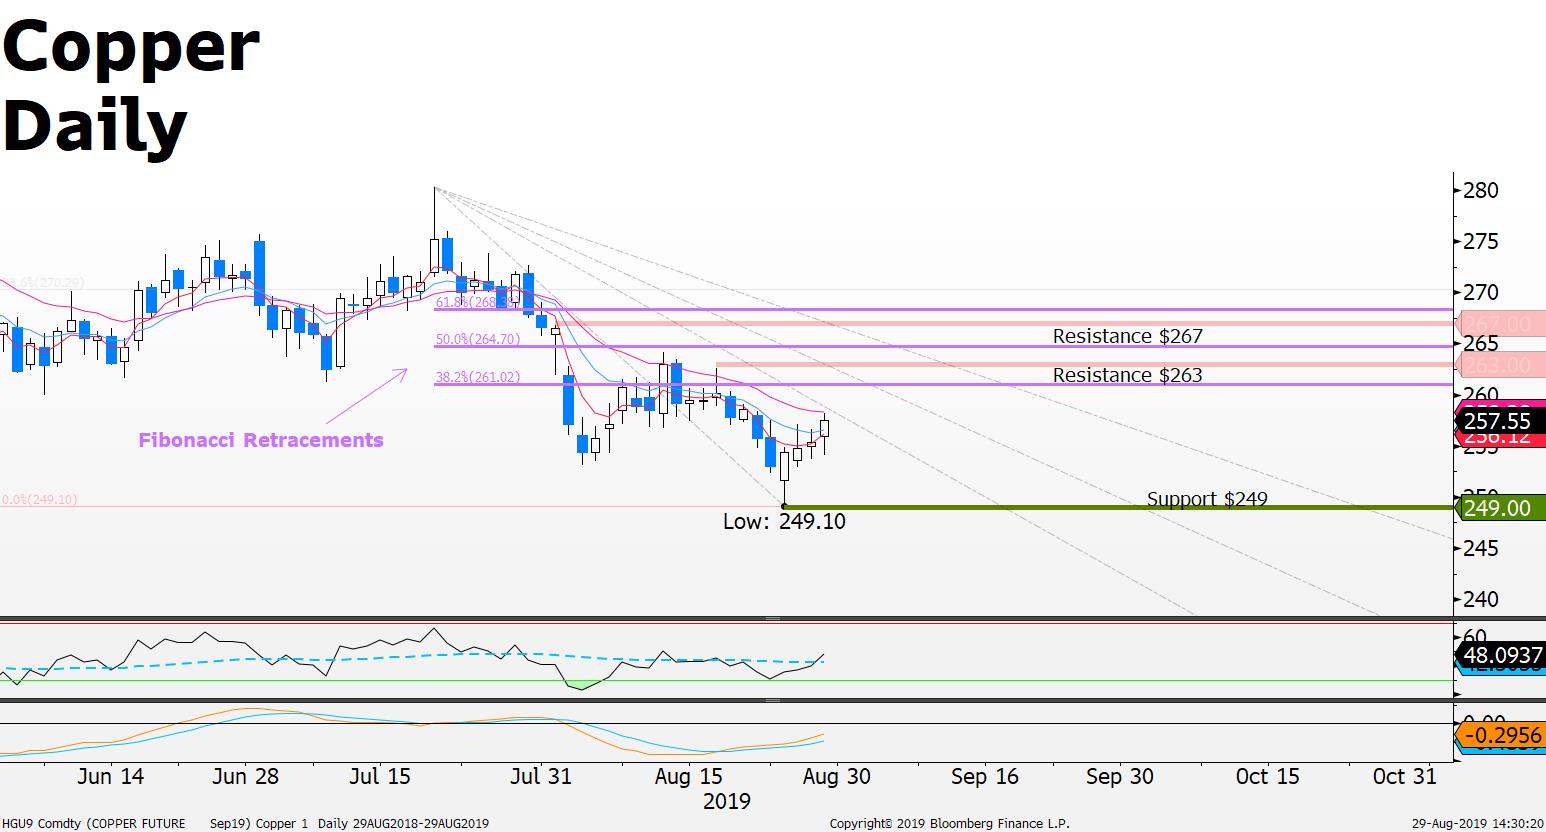
- Copper is an important global base metal used in widespread industries across most sectors of the global economy;
- Demand for Copper can be seen as an indicator of global economic strength or weakness.
- Higher demand may indicate a stronger global economy, lower demand may indicate a weaker global economic outlook;
Commentary: Recent stock market volatility is a result of investor uncertainty after most major stock indices have consolidated (pulled back) from a multi-year stock bull market on signs of weakening economic data. US and European Central Banks have announced and started to take actions to help economies avoid a recession and support the continuation of economic growth, which all goes to plan positive / improving economic data will start to show up in future leading economic indicators.
Technical Analysis: Copper price is in a downtrend since the July high near $272 ; current price $257.55 +3.6% after finding support at the 3 year key support level ($250). Short term moving average analysis is bullish since current price is trading above its 4 period moving average while testing its longer term 18 period moving average; RSI oversold buy signal spotted in early August with current RSI now having crossed above its 14 period moving average (Bullish); Gann Fann analysis indicates potential for price to find some resistance just above current price which may bring out buyers on a break above the Gann Fann (line 1) for a move to test the $263 resistance which sits just above the July high-August low 38.2% retracement.
Source: FXGM / Bloomberg
