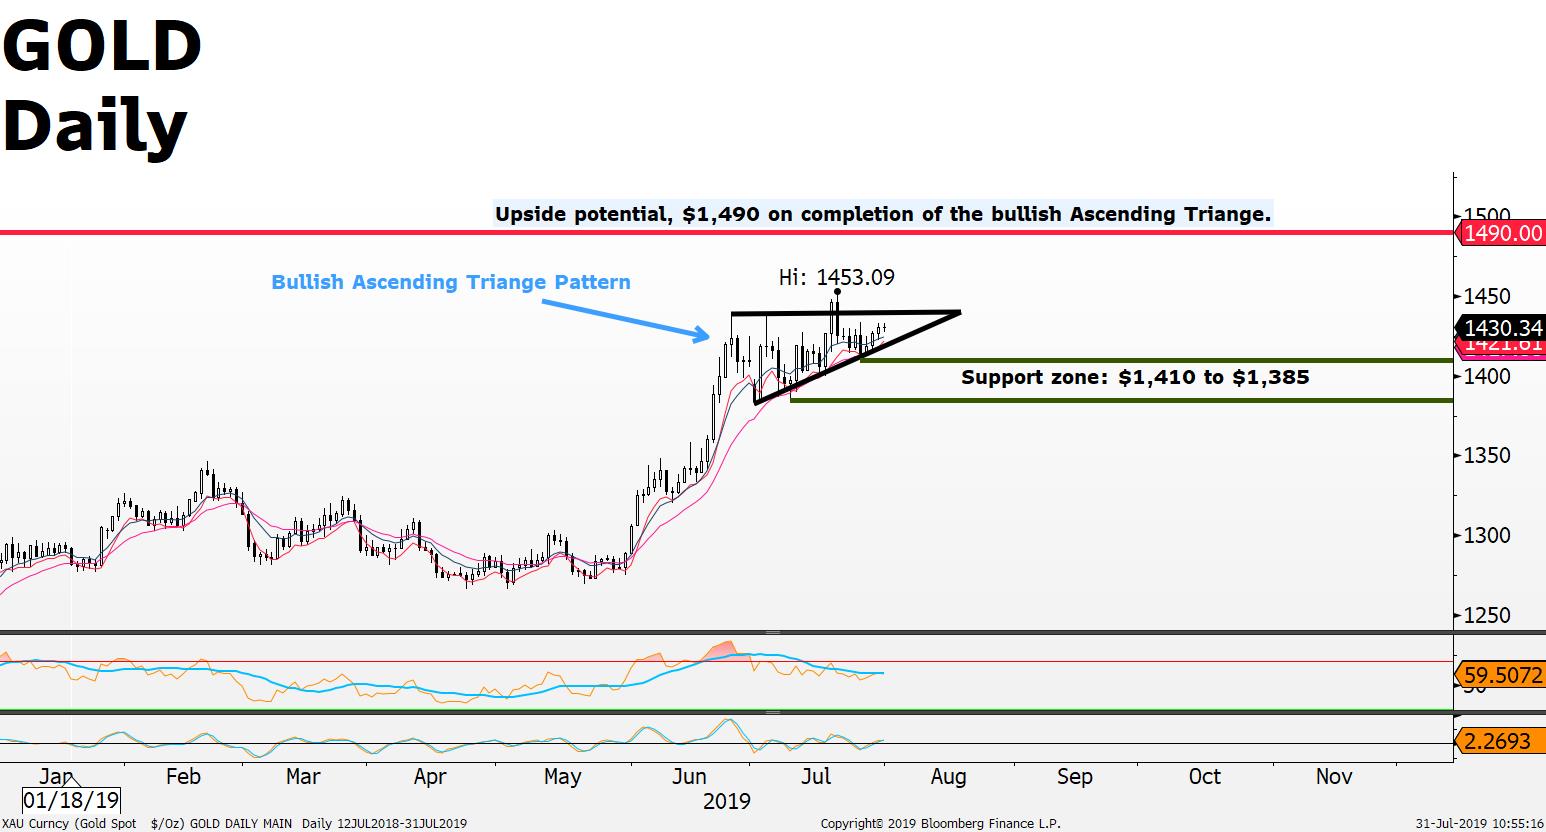
Gold daily chart indicates a bullish Ascending Triangle pattern; the pattern is deemed complete on a decisive close above the upper line (near the 1453.09 price on the chart); This potential break-out should see a sharp increase in trading volume. The upper resistance line (Chart near 1453.09) should act as a support on any potential dips after the break-out. The minimum price objective is forecasted by measuring the height of the triangle and projecting that distance upward from the breakout (chart near 1453.09); upside potential $1,490 on completion of the pattern; otherwise a on a pattern failure downside seen near the $1,410 to $1,385 support zone.
Today 18:00 GMT US Interest Rate Decision:
- forecast to be the first interest rate cut in 10 years;
- markets expecting US Fed Funds interest rate to be cut from 2.5% to 2.25%
Source: FXGM / Bloomberg
